Relative value is the result of dividing (comparing) two absolute values. The numerator of the fraction is the value being compared, and the denominator is the value being compared with (the base of comparison). For example, if we compare the exports of the United States and Russia, which in 2005 amounted to 904.383 and 243.569 billion dollars, respectively, then the relative value will show that the value of US exports is 3.71 times (904.383 / 243.569) more than Russian exports, while the base comparison is the value of Russia's exports. The resulting relative value is expressed as coefficient, which shows how many times the compared absolute value is greater than the base value. AT this example the base of comparison is taken as one. If the base is taken as 100, the relative value is expressed as percent (% ), if for 1000 - in ppm (‰ ). The choice of one form or another of the relative value depends on its absolute value:
- if the compared value is more than the base of comparison by 2 times or more, then choose the form of the coefficient (as in the above example);
- if the relative value is close to one, then, as a rule, it is expressed as a percentage (for example, comparing the values of Russia's exports in 2006 and 2005, which amounted to 304.5 and 243.6 billion dollars, respectively, we can say that exports in 2006 is 125% of 2005);
– if the relative value is significantly less than one (close to zero), it is expressed in ppm (for example, in 2004 Russia exported a total of 4142 thousand tons of oil products to the CIS countries, including 10.7 thousand tons to Georgia, which is 0.0026 or 2.6 ‰ from all exports of petroleum products to the CIS countries).
There are relative values of dynamics, structure, coordination, comparison and intensity, for brevity referred to in the following. indices.
Dynamic index characterizes the change of any phenomenon in time. It is the ratio of the values of the same absolute value in different periods of time. This index is determined by formula (2):
where the numbers mean: 1 - the reporting or analyzed period, 0 - the last or base period.
The criterion value of the dynamics index is one (or 100%), that is, if >1, then there is an increase (increase) in the phenomenon over time; if =1 – stability; if<1 – наблюдается спад (уменьшение) явления. Еще одно название индекса динамики – change index, subtracting from which the unit (100%), get rate of change (dynamics) with criterion value 0, which is determined by formula (3):
If a T>0, then the growth of the phenomenon takes place; T=0 - stability, T<0 – спад.
In the above example about Russian exports in 2006 and 2005, it was the dynamics index that was calculated using formula (2): i D= 304.5/243.6*100% = 125%, which is more than the criterion value of 100%, which indicates an increase in exports. Using formula (3) we obtain the rate of change: T= 125% - 100% = 25%, which shows that exports increased by 25%.
Varieties of the index of dynamics are the indices of the planned task and the execution of the plan, calculated for planning various quantities and monitoring their implementation.
Scheduled Job Index is the ratio of the planned value of the characteristic to the base value. It is determined by formula (4):
where X' 1– planned value; x0 is the base value of the feature.
For example, the customs administration transferred 160 billion rubles to the federal budget in 2006, and planned to transfer 200 billion rubles next year, which means according to formula (4): i pz= 200/160 = 1.25, i.e. the target for the customs administration for 2007 is 125% of the previous year.
To determine the percentage of plan completion, it is necessary to calculate plan execution index, that is, the ratio of the observed value of the attribute to the planned (optimal, maximum possible) value according to the formula (5):
For example, for January-November 2006, the customs authorities planned to transfer 1.955 trillion rubles to the federal budget. rubles, but actually transferred 2.59 trillion. rub., means by the formula (5): i VP= 2.59 / 1.955 = 1.325, or 132.5%, that is, the planned task was completed by 132.5%.
Structure index (share) is the ratio of any part of the object (set) to the entire object. It is determined by formula (6):
In the above example about the export of petroleum products to the CIS countries, the share of this export to Georgia was calculated using the formula (6): d\u003d 10.7 / 4142 \u003d 0.0026, or 2.6 ‰ .
Coordination index- this is the ratio of any part of the object to another part of it, taken as the basis (base of comparison). It is determined by formula (7):
For example, Russia's imports in 2006 amounted to 163.9 billion dollars, then, comparing it with exports (comparison base), we calculate the coordination index using formula (7): i K= 163.9/304.5 = 0.538, which shows the ratio between the two components of the foreign trade turnover, that is, the value of Russia's imports in 2006 is 53.8% of the value of exports. Changing the comparison base to import, using the same formula, we get: i K= 304.5/163.9 = 1.858, that is, Russia's export in 2006 is 1.858 times greater than imports, or exports account for 185.8% of imports.
Comparison Index- this is a comparison (ratio) of different objects according to the same characteristics. It is determined by formula (8):
where BUT, B- compared objects.
In the example discussed above, in which the exports of the United States and Russia were compared, it was the comparison index that was calculated using formula (8): i s= 904.383/243.569 = 3.71. Changing the base of comparison (that is, Russian exports are object A, and US exports are object B), using the same formula, we get: i s= 243.569 / 904.383 = 0.27, that is, Russian exports are 27% of US exports.
Intensity index- this is the ratio of different features of one object to each other. It is determined by formula (9):
where X– one attribute of the object; Y- another sign of the same object
For example, indicators of production output per unit of working time, costs per unit of production, unit prices, etc.
Take a look at the drawing. You see two beakers, each filled with some liquid. Can you tell me which beaker contains the most liquid? If you think it's on the right, you're wrong! The correct answer is this: the error that occurs when measuring the volume of liquid with these beakers does not allow us to say which beaker contains more liquid.
How should this be understood? Let's remember that the use of any measuring instrument is necessarily accompanied by a measurement error. It depends on the value of the division of the scale of this device. Since the divisions on the right beaker are larger, it means that the error in measuring the volume will be greater. We measure the volumes of liquids in beakers, taking into account errors.
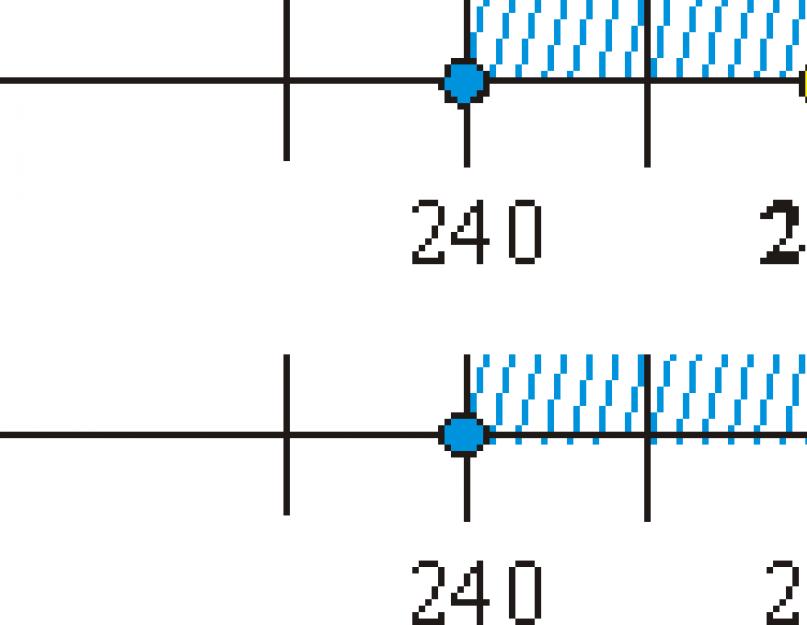
Let's plot the measured values of volumes (marked with yellow dots) and the intervals between the limits of measurement errors on two numerical lines:

In contrast to the measured values, the true values of liquid volumes are in an unknown location within the intervals. The true volume of liquid in the left beaker can be, for example, 270 ml, and the true volume of liquid in the right beaker, for example, 250 ml (marked with red dots).

We deliberately chose the second "red" number less than the first (after all, this situation can also happen). This means that the right beaker may contain a smaller volume of liquid than the left beaker, despite the fact that the liquid level in the right beaker is higher. Unbelievable, but it is a fact!
Since the earliest times, people have been seriously interested in the question of how it is most convenient to compare quantities expressed in different values. And it's not just natural curiosity. The man of the most ancient terrestrial civilizations attached purely applied significance to this rather difficult matter. Correctly measuring the land, determining the weight of the product on the market, calculating the required ratio of goods in barter, determining the correct rate of grapes when harvesting wine - these are just a few of the tasks that often surfaced in the already difficult life of our ancestors. Therefore, poorly educated and illiterate people, if necessary, to compare the values, went for advice to their more experienced comrades, and they often took an appropriate bribe for such a service, and quite a good one, by the way.
What can be compared
Nowadays, this lesson also plays a significant role in the process of studying the exact sciences. Of course, everyone knows that it is necessary to compare homogeneous values, that is, apples with apples, and beets with beets. It would never occur to anyone to try to express degrees Celsius in kilometers or kilograms in decibels, but we have known the length of the boa constrictor in parrots since childhood (for those who do not remember: there are 38 parrots in one boa constrictor). Although parrots are also different, and in fact the length of the boa constrictor will vary depending on the subspecies of the parrot, but these are the details that we will try to figure out.

Dimensions
When the task says: "Compare the values of the quantities", it is necessary to bring these same quantities to the same denominator, that is, to express them in the same values for ease of comparison. It is clear that it will not be difficult for many of us to compare the value expressed in kilograms with the value expressed in centners or in tons. However, there are homogeneous quantities that can be expressed in different dimensions and, moreover, in different measurement systems. Try, for example, comparing kinematic viscosities and determining which fluid is more viscous in centistokes and square meters per second. Does not work? And it won't work. To do this, you need to reflect both values in the same values, and already by the numerical value to determine which of them is superior to the opponent.
Measurement system
In order to understand what quantities can be compared, let's try to recall the existing measurement systems. To optimize and speed up settlement processes in 1875, seventeen countries (including Russia, the USA, Germany, etc.) signed a metric convention and defined the metric system of measures. To develop and consolidate the standards of the meter and kilogram, the International Committee for Weights and Measures was founded, and the International Bureau of Weights and Measures was set up in Paris. This system eventually evolved into the International System of Units, SI. At present, this system is adopted by most countries in the field of technical calculations, including those countries where national ones are traditionally used in everyday life (for example, the USA and England).

GHS
However, in parallel with the generally accepted standard of standards, another, less convenient CGS system (centimeter-gram-second) developed. It was proposed in 1832 by the German physicist Gauss, and in 1874 modernized by Maxwell and Thompson, mainly in the field of electrodynamics. In 1889, a more convenient ISS (meter-kilogram-second) system was proposed. Comparing objects by the size of the reference values of the meter and kilogram is much more convenient for engineers than using their derivatives (centi-, milli-, deci-, etc.). However, this concept also did not find a mass response in the hearts of those for whom it was intended. All over the world, it was actively developed and used, therefore, calculations in the CGS were carried out less and less, and after 1960, with the introduction of the SI system, the CGS practically fell into disuse. At present, the CGS is actually used in practice only in calculations in theoretical mechanics and astrophysics, and then because of the simpler form of writing the laws of electromagnetism.

Step-by-step instruction
Let's analyze an example in detail. Suppose the problem is: "Compare the values of 25 tons and 19570 kg. Which of the values is greater?" The first thing to do is to determine in what quantities we have given values. So, the first value is given in tons, and the second - in kilograms. At the second step, we check whether the compilers of the problem are trying to mislead us by trying to force us to compare heterogeneous quantities. There are also such trap tasks, especially in quick tests, where 20-30 seconds are given to answer each question. As we can see, the values are homogeneous: both in kilograms and in tons, we measure the mass and weight of the body, so the second test was passed with a positive result. The third step, we translate kilograms into tons or, conversely, tons into kilograms for ease of comparison. In the first version, 25 and 19.57 tons are obtained, and in the second: 25,000 and 19,570 kilograms. And now you can compare the magnitudes of these values with peace of mind. As can be clearly seen, the first value (25 tons) in both cases is greater than the second (19,570 kg).

Traps
As mentioned above, modern tests contain a lot of deception tasks. These are not necessarily tasks that we have analyzed, a rather harmless-looking question can turn out to be a trap, especially one where a completely logical answer suggests itself. However, the deceit, as a rule, lies in the details or in a small nuance that the compilers of the task are trying to disguise in every possible way. For example, instead of the question already familiar to you from the analyzed problems with the formulation of the question: "Compare values where possible" - the compilers of the test can simply ask you to compare the indicated values, and choose the values themselves strikingly similar to each other. For example, kg * m / s 2 and m / s 2. In the first case, this is the force acting on the object (newtons), and in the second - the acceleration of the body, or m / s 2 and m / s, where you are asked to compare the acceleration with the speed of the body, that is, absolutely heterogeneous quantities.

Complex comparisons
However, very often two values are given in tasks, expressed not only in different units of measurement and in different systems of calculation, but also different from each other in the specifics of the physical meaning. For example, the statement of the problem says: "Compare the values of the dynamic and kinematic viscosities and determine which liquid is more viscous." In this case, the values are indicated in SI units, that is, in m 2 / s, and dynamic - in CGS, that is, in poise. How to proceed in this case?
To solve such problems, you can use the instructions presented above with a small addition to it. We decide in which of the systems we will work: let it be generally accepted among engineers. In the second step, we also check if this is a trap? But in this example, too, everything is clean. We compare two fluids in terms of internal friction (viscosity), so both values are homogeneous. The third step is to convert from poise to pascal second, that is, to the generally accepted units of the SI system. Next, we translate the kinematic viscosity into dynamic, multiplying it by the corresponding value of the density of the liquid (table value), and compare the results obtained.
Out of the system
There are also non-systemic units of measurement, that is, units that are not included in the SI, but according to the results of the decisions of the convening of the General Conference on Weights and Measures (GCVM), acceptable for sharing with the SI. It is possible to compare such quantities with each other only when they are reduced to a general form in the SI standard. Non-systemic units include such units as minute, hour, day, liter, electron volt, knot, hectare, bar, angstrom and many others.
First, consider the problem of comparing the value measured in the experiment with the constant a. The value can only be determined approximately by calculating the average over the measurements. We need to find out if the relation holds. In this case, two tasks are posed, direct and inverse:
a) from a known value, find the constant a, which is exceeded with a given probability
b) find the probability that , where a is a given constant.
Obviously, if then the probability that is less than 1/2. This case is of no interest, and further we will assume that
The problem is reduced to the problems discussed in Section 2. Let X and its standard be defined by measurements

The number of measurements will be considered not very small, so there is a random variable with a normal distribution. Then from the Student's criterion (9), taking into account the symmetry of the normal distribution, it follows that for an arbitrarily chosen probability, the condition
Let's rewrite this expression in the following form:
where are the Student's coefficients given in Table 23. Thus, the direct problem is solved: a constant a is found, which with probability exceeds
The inverse problem is solved using the direct one. Let us rewrite formulas (23) as follows:
This means that you need to calculate t from the known values of a, select the row with the data in table 23 - and find the corresponding value from the value of t. It determines the desired probability
Two random variables. It is often required to establish the influence of some factor on the quantity under study - for example, whether (and how much) a certain additive increases the strength of the metal. To do this, it is necessary to measure the strength of the original metal and the strength of the alloyed metal y and compare these two quantities, i.e. find
The compared values are random; Thus, the properties of a certain grade of metal vary from heat to heat, since the raw materials and the melting regime are not strictly the same. Let's denote these quantities by . The magnitude of the studied effect is equal and it is required to determine whether the condition is met
Thus, the problem was reduced to the comparison of a random variable with a constant a, discussed above. The direct and inverse comparison problems in this case are formulated as follows:
a) according to the measurement results, find the constant a, which exceeds with a given probability (i.e., estimate the magnitude of the effect under study);
b) determine the probability that where a is the desired effect size; this means that it is necessary to determine the probability with which
To solve these problems, it is necessary to calculate z and the variance of this quantity. Let's look at two ways to find them.
Independent measurements. Let us measure the value in experiments, and the value in experiments independent of the first experiments. We calculate the average values using the usual formulas:

These means are themselves random variables, and their standards (not to be confused with the standards of single measurements!) are approximately determined by unbiased estimates:
Since the experiments are independent, the random variables x and y are also independent, so that when calculating their mathematical expectations are subtracted, and the variances are added:

A slightly more accurate estimate of the variance is:
Thus, its dispersion is also found, and further calculations are made using formulas (23) or (24).
Consistent measurements. A higher accuracy is obtained by another method of processing, when in each of the experiments simultaneously measure . For example, after the release of half of the melt, an additive is added to the metal remaining in the furnace, and then metal samples from each half of the melt are compared.
In this case, in essence, in each experiment, the value of one random variable is measured immediately, which must be compared with the constant a. Measurements are then processed according to formulas (21)–(24), where z must be substituted everywhere.
The variance for consistent measurements will be smaller than for independent ones, since it is due only to a part of random factors: those factors that consistently change do not affect the spread of their difference. Therefore, this method allows to obtain more reliable conclusions.
Example. An interesting illustration of the comparison of values is the determination of the winner in those sports where judging is carried out "by eye" - gymnastics, figure skating, etc.
Table 24. Judging scores

Table 24 shows the protocol of dressage competitions at the 1972 Olympics. It can be seen that the spread of judges' marks is large, and not a single mark can be recognized as grossly erroneous and discarded. At first glance, it seems that the reliability of determining the winner is low.
Let's calculate how correctly the winner is determined, i.e. what is the probability of the event . Since both riders were scored by the same judges, the matched measurement method can be used. According to table 24, we calculate by substituting these values into formula (24) and get .
Choosing a row in table 23, we find that this value of t corresponds to Hence, i.e., with a probability of 90%, the gold medal was awarded correctly.
Comparison by independent measurement method will give a slightly worse score, since it does not use the information that the marks were given by the same judges.
Comparison of variances. Let it be required to compare two experimental methods. Obviously, the more accurate method is the one in which the variance of a single measurement is smaller (of course, if the systematic error does not increase). So, we need to establish whether the inequality is satisfied.
Valery Galasyuk- Academician of the AES of Ukraine, General Director of the COWPERWOOD auditing firm (Dnepropetrovsk), Member of the Presidium of the Council of the Union of Auditors of Ukraine, Member of the Audit Chamber of Ukraine, Chairman of the Audit Commission of the Ukrainian Society of Appraisers, Deputy Chairman of the Board of the Association of Taxpayers of Ukraine, Deputy Chairman of the Commission for Evaluation of Efficiency investment activity of the Ukrainian Society of Financial Analysts, leading appraiser of the Ukrainian Society of Appraisers
Victor Galasyuk– Director of the Department of Credit Consulting of the information and consulting company “INCON-CENTER” (consulting group “COWPERWOOD”), Master of Economics of the Enterprise, laureate of competitions for young appraisers of the Ukrainian Society of Appraisers
Mathematics is the only perfect method
allowing himself to be led by the nose
Einstein
My job is to tell the truth, not to make you believe in it.
Rousseau
This article is devoted to the fundamental problem that arises in the process of numerical comparison of quantities. The essence of this problem lies in the fact that, under certain conditions, various methods of numerical comparison of the same quantities fix a different degree of their inequality. The uniqueness of this problem lies not so much in the fact that it has not yet been solved, although it would seem that the procedures for numerical comparison have been thoroughly studied and do not raise questions even among schoolchildren, but in the fact that it has not yet been adequately reflected in public consciousness and, more importantly, in practice.
As you know, you can compare two values numerically either by answering the question “How much is one value greater than the other?” Or by answering the question “How many times is one value greater than the other?”. That is, in order to numerically compare two quantities, you must either subtract one from the other (), or divide one by the other (). At the same time, as studies have shown, there are only two initial types of criteria for numerical comparison of quantities: and , and none of them has the exclusive right to exist.
Only 13 qualitatively different variants of the ratio on the numerical axis of the values of the two compared values X and Y are possible (see Fig. 1) .
When comparing two values X and Y based on the comparison criterion with any variant of their ratio on the number axis, there are no problems. Indeed, regardless of the values of X and Y, the comparison criterion uniquely characterizes the distance between points X and Y on the real axis.

However, the use of the comparison criterion to compare the values of X and Y in some cases of their relationship on the number axis can lead to problems, since in these cases the values of the X and Y values can have a significant impact on the results of the comparison. For example, when comparing the values of 0.0100000001 and 0.0000000001, corresponding to option 5 on the Galasyuk's beads, using the comparison criterion shows that the first number is greater than the second by 0.01, and using the comparison criterion shows that the first number is greater than the second by 100 000,001 times. Thus, with a certain ratio of compared values on the numerical axis, the comparison criterion indicates slight degree of inequality compared values X and Y, and the criterion of comparison points to a significant degree of their inequality.
Or, for example, when comparing the values \u200b\u200bof 1,000,000,000 100 and
1 000 000 000 000, corresponding to the same option 5 on the "rosary of Galasyuk", the use of the comparison criterion shows that the first number is greater than the second by 100, and the use of the comparison criterion shows that the first number is approximately equal to the second, since it is greater than the second number only in 1.0000000001 times. Thus, with a certain ratio of compared values on the numerical axis, the comparison criterion indicates significant degree of inequality compared values X and Y, and the criterion of comparison points to a slight degree of their inequality.
Since the problem discussed in this article arises only when using the comparison criterion , then to study it, we consider the comparison of two quantities m and n based on the comparison criterion. To compare these quantities, we divide m on the n: .
Analysis of the results of comparison of values m and n can be carried out in two stages: at the first stage, we take the denominator of the ratio unchanged - the value n, on the second numerator - the value m(see fig. 2).
To carry out the first stage of the analysis, we construct a graph of the dependence of the ratio on the value m(see Fig. 3), while it should be noted that when n=0 relation is not defined.
As seen in Figure 3, if n=const, n¹0, then for |m|→∞ the relation | |→∞, and for |m|→0 the relation | |→0.
To implement the second stage of the analysis, we construct a graph of the dependence of the ratio on the value n(see Fig. 4), while it should be noted that when n=0 relation is not defined.
As seen in Figure 4, if m=const, m¹0, n¹0, then for |n|→∞ the relation | |→0, and for |n|→0 the relation | |→∞. It should be noted that as the values of | n| equal changes | n| involve ever smaller changes in attitude | |. And when approaching zero values | n| equal changes | n| entail ever-greater changes in attitude | |.

Summarizing the results of stages I and II of the analysis, we present them in the form of the following table, including in it the results of the comparison analysis based on the initial type of criteria (see Table 1). Situations in which X=0 and Y=0 are not considered here. We hope to analyze them in the future.
Table 1
Generalized results of the analysis of comparison of valuesXandY
based on two original types of comparison criteria
(X¹ 0 andY¹ 0)
|
7. Galasyuk V.V. How many initial types of cost-effectiveness criteria should there be: one, two, three…?//Stock market.-2000.-№3.-p.39-42. 8. Galasyuk V.V. On two initial types of cost-effectiveness criteria//Questions of evaluation, Moscow.-2000.-№1.-p.37-40. 9. Poincaré Henri. About science: Per. from French-M.-Nauka. Main edition of physical and mathematical literature, 1983.-560 p. 20.10.2002 |


