Lesson Objectives:
Training: Repeat theoretical information on the topic "Application of the derivative" to summarize, consolidate and improve knowledge on this topic.
To teach how to apply the acquired theoretical knowledge in solving various types of mathematical problems.
Consider methods for solving USE tasks related to the concept of a derivative of a basic and advanced level of complexity.
Educational:
Skills training: planning activities, working at an optimal pace, working in a group, debriefing.
Develop the ability to assess their abilities, the ability to contact with comrades.
Cultivate a sense of responsibility and empathy. Contribute to the development of the ability to work in a team; skills .. refers to the opinion of classmates.
Developing: To be able to formulate the key concepts of the topic under study. Develop group work skills.
Lesson type: combined:
Generalization, consolidation of skills, application of the properties of elementary functions, application of already formed knowledge, skills and abilities, application of the derivative in non-standard situations.
Equipment: computer, projector, screen, handout.
Lesson plan:
1. Organizational activity
Mood reflection
2. Actualization of the student's knowledge
3. Oral work
4. Independent work in groups
5. Protection of work performed
6. Independent work
7. Homework
8. Summary of the lesson
9. Mood reflection
During the classes
1. Reflection of mood.
Guys, good morning. I came to your lesson with such a mood (showing the image of the sun)!
What is your mood?
On your table are cards with images of the sun, the sun behind the clouds and clouds. Show what your mood is.
2. Analyzing the results of trial exams, as well as the results of the final certification of recent years, we can conclude that with the tasks of mathematical analysis, from USE work no more than 30% -35% of graduates manage to cope. So in our class, according to the results of training and diagnostic work not all of them do it right. This is the reason for our choice. We will practice the skill of using the derivative when solving USE tasks.
In addition to the problems of final certification, there are questions and doubts about the extent to which the knowledge acquired in this area can and will be in demand in the future, how justified both the time and health spent on studying this topic.
Why is a derivative needed? Where do we meet the derivative and use it? Is it possible to do without it in mathematics and not only?
Student message 3 minutes -
3. Oral work.
4. Independent work in groups (3 groups)
Task 1 group
) What is the geometric meaning of the derivative?
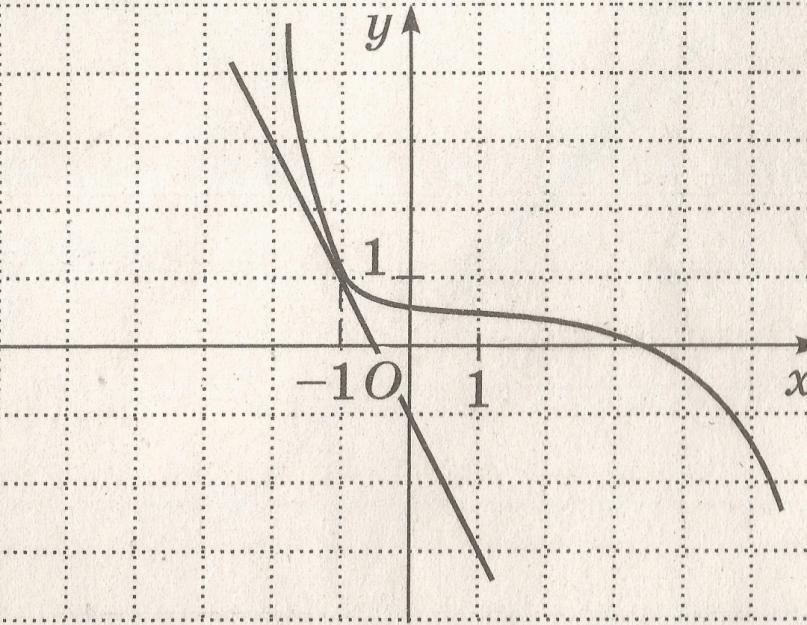
2) a) The figure shows the graph of the function y \u003d f (x) and the tangent to this graph, drawn at the point with the abscissa x0. Find the value of the derivative of the function f(x) at the point x0.
b) The figure shows the graph of the function y=f(x) and the tangent to this graph drawn at the point with the abscissa x0. Find the value of the derivative of the function f(x) at the point x0.

Group 1 response:
1) The value of the derivative of the function at the point x = x0 is equal to the conditional coefficient of the tangent drawn to the graph of this function at the point with the x0 abscissa.
2) A)f1(x)=4/2=2
3) B) f1(x)=-4/2=-2
Task 2 groups
1) What is the physical meaning of the derivative?
2) A material point moves in a straight line according to the law
x(t)=-t2+8t-21, where x is the distance from the reference point in meters, t is the time in seconds measured from the start of the movement. Find its speed (in meters per second) at time t=3 s.
3) A material point moves in a straight line according to the law
x(t)= ½*t2-t-4, where x is the distance from the reference point in meters, t is the time in seconds measured from the start of the movement. At what point in time (in seconds) was her speed equal to 6 m/s?
Group 2 answer:
1) The physical (mechanical) meaning of the derivative is as follows.
If S(t) is the law of rectilinear motion of a body, then the derivative expresses the instantaneous speed at time t:
V(t)=-x(t)=-2t=8=-2*3+8=2
3) X(t)=1/2t^2-t-4
Task 3 groups
1) The line y= 3x-5 is parallel to the tangent to the graph of the function y=x2+2x-7. Find the abscissa of the point of contact.
2) The figure shows a graph of the function y=f(x), defined on the interval (-9;8). Determine the number of integer points in this interval at which the derivative of the function f(x) is positive.

Group 3 answer:
1) Since the line y=3x-5 is parallel to the tangent, then the slope of the tangent is equal to the slope of the line y=3x-5, that is, k=3.
Y1(x)=3 ,y1=(x^2+2x-7)1=2x=2 2x+2=3
2) Integer points are points with integer abscissa values.
The derivative function f(x) is positive if the function is increasing.
Question: What can you say about the derivative of the function, which is described by the saying "The farther into the forest, the more firewood"
Answer: The derivative is positive over the entire domain of definition, because this function is monotonically increasing
6. Independent work (for 6 options)
7. Homework.
Training work Answers:
Summary of the lesson.
“Music can elevate or pacify the soul, painting can please the eye, poetry can awaken feelings, philosophy can satisfy the needs of the mind, engineering can improve the material side of people's lives. But mathematics is able to achieve all these goals.
So said the American mathematician Maurice Kline.
Thank you for your work!
In task number 13 of the exam in mathematics basic level you will have to demonstrate the skills and knowledge of one of the concepts of the behavior of a function: derivatives at a point or rates of increase or decrease. The theory for this task will be added a little later, but this will not prevent us from analyzing several typical options in detail.
Analysis of typical options for tasks No. 14 USE in mathematics of a basic level
Option 14MB1
The graph shows the dependence of temperature on time in the process of warming up the engine of a car. The horizontal axis indicates the time in minutes that has elapsed since the engine was started; on the vertical axis is the engine temperature in degrees Celsius.

Using the graph, match each time interval with the characteristics of the engine warm-up process at this interval.
In the table, under each letter, indicate the corresponding number.
Execution algorithm:
- Select the time interval in which the temperature dropped.
- Attach a ruler to 30°C and determine the time interval at which the temperature was below 30°C.
Solution:
Let us choose the time interval in which the temperature dropped. This section is visible to the naked eye, it begins 8 minutes from the moment the engine is started.
Apply a ruler to 30°C and determine the time interval at which the temperature was below 30°C.

Below the ruler there will be a section corresponding to the time interval 0 - 1 min.
With the help of a pencil and a ruler, we find at what time interval the temperature was in the range from 40 ° C to 80 ° C.
From the points corresponding to 40°C and 80°C we drop the perpendiculars onto the graph, and from the obtained points we drop the perpendiculars onto the time axis.

We see that this temperature interval corresponds to a time interval of 3 - 6.5 min. That is, from those given in the condition 3 - 6 min.
Select the missing answer using the elimination method.
Option 14MB2
Solution:
Let's analyze the graph of function A. If the function increases, then the derivative is positive and vice versa. The derivative of the function is equal to zero at the extremum points.
First, the function A increases, i.e. the derivative is positive. This corresponds to the graphs of derivatives 2 and 3. At the maximum point of the function x = -2, that is, at this point, the derivative should be equal to zero. This condition corresponds to the graph number 3.
First, function B decreases, i.e. the derivative is negative. This corresponds to the graphs of derivatives 1 and 4. The maximum point of the function x \u003d -2, that is, at this point the derivative should be equal to zero. This condition corresponds to the graph number 4.
First, the function B increases, i.e. the derivative is positive. This corresponds to the graphs of derivatives 2 and 3. The maximum point of the function x = 1, that is, at this point, the derivative should be equal to zero. This condition corresponds to the graph number 2.
By the method of elimination, we can determine that the graph of the function Г corresponds to the graph of the derivative at number 1.
Answer: 3421.
Option 14MB3
The execution algorithm for each of the functions:
- Determine the intervals of increasing and decreasing functions.
- Determine the maximum and minimum points of the functions.
- Draw conclusions, match the proposed schedules.
Solution:
Let's analyze the graph of function A.
If the function is increasing, then the derivative is positive and vice versa. The derivative of the function is equal to zero at the extremum points.
The extremum point is the point at which the maximum or minimum value of the function is reached.
First, the function A increases, i.e. the derivative is positive. This corresponds to the graphs of derivatives 3 and 4. At the maximum point of the function x=0, that is, at this point, the derivative should be equal to zero. This condition corresponds to the graph number 4.
Let's analyze the graph of function B.
First, function B decreases, i.e. the derivative is negative. This corresponds to the graphs of derivatives 1 and 2. The minimum point of the function x=-1, that is, at this point the derivative must be equal to zero. This condition corresponds to the graph number 2.
Let's analyze the graph of the function B.
First, the function B decreases, i.e. the derivative is negative. This corresponds to the graphs of derivatives 1 and 2. The minimum point of the function x \u003d 0, that is, at this point the derivative should be equal to zero. This condition corresponds to the graph number 1.
By the method of elimination, we can determine that the graph of the function Г corresponds to the graph of the derivative at number 3.
Answer: 4213.
Option 14MB4
The figure shows a graph of a function and tangents drawn to it at points with abscissas A, B, C and D.The right column shows the values of the derivative at points A, B, C and D. Using the graph, match each point with the value of the derivative of the function at it.

POINTS
BUT
AT
FROM
D
DERIVATIVE VALUES
1) –4
2) 3
3) 2/3
4) -1/2
Recall what the derivative means, namely its value at the point - the value of the derivative function at a point is equal to the tangent of the slope (coefficient) of the tangent.
In the answers we have two positive and two negative options. As we remember, if the coefficient is direct (graphics y = kx + b) is positive, then the line is increasing; if it is negative, then the line is decreasing.
We have two ascending lines - at the point A and D. Now let's remember what does the value of the coefficient k mean?
The coefficient k shows how fast the function increases or decreases (in fact, the coefficient k itself is the derivative of the function y = kx + b).
Therefore, k \u003d 2/3 corresponds to a more gentle straight line - D, and k \u003d 3 - A.
Similarly, in the case of negative values: point B corresponds to a steeper straight line with k = -4, and point C - -1/2.
Option 14MB5
In the figure, the dots show the volume of monthly sales of heaters in a household appliance store. Months are indicated horizontally, the number of heaters sold is indicated vertically. For clarity, the points are connected by a line.

Using the figure, match each of the indicated time periods with the characteristics of sales of heaters.

Execution algorithm
We analyze the parts of the graph corresponding to different seasons. We formulate the situations displayed on the graph. We find the most suitable answers for them.
Solution:
In winter, the number of sales exceeded 120 pieces / month, and it has been increasing all the time. This situation corresponds to answer 3. Those. we get: A-3.
In the spring, sales gradually fell from 120 heaters per month to 50. Option No. 2 is closest to this formulation. We have: B–2.
In the summer, the number of sales did not change and was minimal. The 2nd part of this wording is not reflected in the answers, and only No. 4 is suitable for the first. Hence we have: AT 4.
In the fall, sales grew, but their number did not exceed 100 pieces in any of the months. This situation is described in option #1. We get: G–1.
Option 14MB6
The graph shows the dependence of the speed of a regular bus on time. The vertical axis shows the speed of the bus in km/h, the horizontal axis shows the time in minutes since the start of the bus.
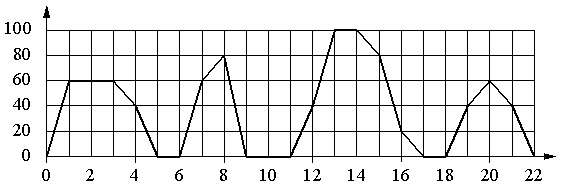
Using the graph, match each time interval with the characteristic of the bus movement at this interval.

Execution algorithm
- We determine the division price on the horizontal and vertical scales.
- We analyze in turn the proposed statements 1–4 from the right column (“Characteristics”). We compare them with time intervals from the left column of the table, we find pairs of "letter-number" for the answer.
Solution:
The division value of the horizontal scale is 1 s, the vertical scale is 20 km/h.
- When the bus stops, its speed is 0. For 2 minutes in a row, the bus had zero speed only from the 9th to the 11th minute. This time falls within the interval of 8–12 min. So we have a couple for the answer: B–1.
- The bus had a speed of 20 km/h or more for several time periods. Moreover, option A is not suitable here, because, for example, at the 7th minute the speed was 60 km / h, option B - because it has already been applied, option D - because at the beginning and end of the interval the bus had zero speed . In this case, option B is suitable (12–16 minutes); at this interval, the bus starts moving at a speed of 40 km/h, then accelerates to 100 km/m and then gradually reduces the speed to 20 km/h. So we have: IN 2.
- This is where the speed limit is set. We do not consider options B and C. The remaining intervals A and G are both suitable. Therefore, it would be correct to consider first the 4th option, and then return to the 3rd one again.
- Of the two remaining intervals, only 4–8 minutes are suitable for characteristic No. 4, since there was a stop at this interval (at the 6th minute). There were no stops during the interval of 18–22 minutes. We get: A-4. It follows from this that for characteristic No. 3 it is necessary to take the interval Г, i.e. it turns out a couple G–3.
Option 14MB7
The dotted figure shows China's population growth from 2004 to 2013. The year is indicated horizontally, the population growth as a percentage (an increase in the population relative to the previous year) is indicated vertically. For clarity, the points are connected by a line.

Using the diagram, match each of the indicated time periods with a characteristic of China's population growth during this period..

Execution algorithm
- Determine the value of division of the vertical scale of the picture. It is found as the difference between a pair of adjacent scale values divided by 2 (because there are 2 divisions between two adjacent values).
- We analyze the characteristics 1–4 sequentially given in the condition (left tabular column). We compare each of them with a specific period of time (right table column).
Solution:
The division value of the vertical scale is 0.01%.
- Growth decline continued continuously from 2004 to 2010. In 2010-2011, the increase was consistently minimal, and starting from 2012, it began to increase. Those. Growth stopped in 2010. This year is in the period 2009-2011. Accordingly, we have: IN 1.
- The largest drop in growth should be considered the most “steeply” falling line of the graph in the figure. It falls on the period 2006-2007. and is 0.04% per year (0.59–0.56=0.04% in 2006 and 0.56–0.52=0.04% in 2007). From here we get: A-2.
- The growth indicated in characteristic No. 3 began in 2007, continued in 2008 and ended in 2009. This corresponds to time period B, i.e. we have: B–3.
- Population growth began to increase after 2011, i.e. in 2012–2013 Therefore we get: G–4.
Option 14MB8
The figure shows a function graph and tangents drawn to it at points with abscissas A, B, C and D.

The right column shows the values of the derivative of the function at points A, B, C and D. Using the graph, match each point with the value of the derivative of the function at it.

Execution algorithm
- We consider a pair of tangents that have an acute angle with the positive direction of the x-axis. We compare them, find a match among the pair of corresponding values of the derivatives.
- We consider a pair of tangents forming an obtuse angle with the positive direction of the x-axis. We compare them modulo, we determine the correspondence to their values of derivatives among the two remaining in the right column.
Solution:
An acute angle with a positive direction of the x-axis is formed by derivatives in t.B and t.C. These derivatives have positive values. Therefore, one should choose here between the values \u200b\u200bNo. 1 and 3. Applying the rule that if the angle is less than 45 0, then the derivative is less than 1, and if more, then more than 1, we conclude: in t.B, the modulo derivative is greater than 1, in t.C - less than 1. This means that you can make pairs for the answer: AT 3 and S-1.
The derivatives in t.A and t.D form an obtuse angle with the positive direction of the x-axis. And here we apply the same rule, slightly paraphrasing it: the more the tangent at the point is “pressed” to the line of the abscissa axis (to its negative direction), the greater it is in absolute value. Then we get: the derivative at point A is less in absolute value than the derivative at point D. From here we have pairs for the answer: A-2 and D-4.
Option 14MB9
Dots in the figure show the average daily air temperature in Moscow in January 2011. Dates of the month are indicated horizontally, temperatures in degrees Celsius are indicated vertically. For clarity, the points are connected by a line.

Using the figure, match each of the indicated time periods with a characteristic of temperature change.

Execution algorithm
We analyze sequentially characteristics 1–4 (right column), using the graph in the figure. We put each of them in line with a specific time period (left column).
Solution:
- An increase in temperature was observed only at the end of the period on January 22–28. Here, on the 27th and 28th, it increased by 1 and 2 degrees, respectively. At the end of the period on January 1–7, the temperature was stable (–10 degrees), at the end of January 8–14 and 15–21 it dropped (from –1 to –2 and from –11 to –12 degrees, respectively). Therefore we get: G–1.
- Since each time period covers 7 days, the temperature should be analyzed starting from the 4th day of each period. The temperature remained unchanged for 3–4 days only from 4 to 7 January. So we get the answer: A-2.
- The monthly minimum temperature was observed on January 17. This number falls within the period January 15–21. From here we have a couple: AT 3.
- The temperature maximum fell on January 10 and amounted to +1 degree. This date falls within the period of January 8–14. So we have: B-4.
Option 14MB10
Execution algorithm
- The function value at a point is positive if this point is located above the Ox axis.
- The derivative at a point is greater than zero if the tangent to that point forms an acute angle with the positive direction of the x-axis.
Solution:
Point A. It is below the Ox axis, which means the value of the function in it is negative. If we draw a tangent in it, then the angle between it and the positive direction Ox will be about 90 0, i.e. forms an acute angle. So, in this case, characteristic number 3 is suitable. Those. we have: A-3.
Point B. It is located above the Ox axis, i.e. the point has a positive function value. The tangent at this point will be quite close to the abscissa axis, forming an obtuse angle (slightly less than 180 0) with its positive direction. Accordingly, the derivative at this point is negative. Thus, characteristic 1 is suitable here. We get the answer: IN 1.
Point C. The point is located below the Ox axis, the tangent in it forms a large obtuse angle with the positive direction of the abscissa axis. Those. in t.C, the value of both the function and the derivative is negative, which corresponds to characteristic No. 2. Answer: S-2.
Point D. The point is located above the Ox axis, and the tangent in it forms an acute angle with the positive direction of the axis. This suggests that both the value of the function and the value of the derivative are greater than zero here. Answer: D-4.
Option 14MB11
In the figure, the dots show the volume of monthly sales of refrigerators in a household appliance store. Months are indicated horizontally, the number of refrigerators sold is indicated vertically. For clarity, the points are connected by a line.

Using the figure, match each of the indicated time periods with the characteristics of sales of refrigerators.
It's very easy to remember.
Well, we will not go far, we will immediately consider the inverse function. What is the inverse of the exponential function? Logarithm:
In our case, the base is a number:
Such a logarithm (that is, a logarithm with a base) is called a “natural” one, and we use a special notation for it: we write instead.
What is equal to? Of course, .
The derivative of the natural logarithm is also very simple:
Examples:
- Find the derivative of the function.
- What is the derivative of the function?
Answers: The exponent and the natural logarithm are functions that are uniquely simple in terms of the derivative. Exponential and logarithmic functions with any other base will have a different derivative, which we will analyze later, after we go through the rules of differentiation.
Differentiation rules
What rules? Another new term, again?!...
Differentiation is the process of finding the derivative.
Only and everything. What is another word for this process? Not proizvodnovanie... The differential of mathematics is called the very increment of the function at. This term comes from the Latin differentia - difference. Here.
When deriving all these rules, we will use two functions, for example, and. We will also need formulas for their increments:
There are 5 rules in total.
The constant is taken out of the sign of the derivative.
If - some constant number (constant), then.
Obviously, this rule also works for the difference: .
Let's prove it. Let, or easier.
Examples.
Find derivatives of functions:
- at the point;
- at the point;
- at the point;
- at the point.
Solutions:
- (the derivative is the same at all points, since it's a linear function, remember?);
Derivative of a product
Everything is similar here: we introduce a new function and find its increment:
Derivative:
Examples:
- Find derivatives of functions and;
- Find the derivative of a function at a point.
Solutions:
Derivative of exponential function
Now your knowledge is enough to learn how to find the derivative of any exponential function, and not just the exponent (have you forgotten what it is yet?).
So where is some number.
We already know the derivative of the function, so let's try to bring our function to a new base:
To do this, we use a simple rule: . Then:
Well, it worked. Now try to find the derivative, and don't forget that this function is complex.
Happened?
Here, check yourself:
The formula turned out to be very similar to the derivative of the exponent: as it was, it remains, only a factor appeared, which is just a number, but not a variable.
Examples:
Find derivatives of functions:
Answers:
This is just a number that cannot be calculated without a calculator, that is, it cannot be written in a simpler form. Therefore, in the answer it is left in this form.
Note that here is the quotient of two functions, so we apply the appropriate differentiation rule:
In this example, the product of two functions:
Derivative of a logarithmic function
Here it is similar: you already know the derivative of the natural logarithm:
Therefore, to find an arbitrary from the logarithm with a different base, for example, :
We need to bring this logarithm to the base. How do you change the base of a logarithm? I hope you remember this formula:
Only now instead of we will write:
The denominator turned out to be just a constant (a constant number, without a variable). The derivative is very simple:
Derivatives of the exponential and logarithmic functions are almost never found in the exam, but it will not be superfluous to know them.
Derivative of a complex function.
What is a "complex function"? No, this is not a logarithm, and not an arc tangent. These functions can be difficult to understand (although if the logarithm seems difficult to you, read the topic "Logarithms" and everything will work out), but in terms of mathematics, the word "complex" does not mean "difficult".
Imagine a small conveyor: two people are sitting and doing some actions with some objects. For example, the first wraps a chocolate bar in a wrapper, and the second ties it with a ribbon. It turns out such a composite object: a chocolate bar wrapped and tied with a ribbon. To eat a chocolate bar, you need to do the opposite steps in reverse order.
Let's create a similar mathematical pipeline: first we will find the cosine of a number, and then we will square the resulting number. So, they give us a number (chocolate), I find its cosine (wrapper), and then you square what I got (tie it with a ribbon). What happened? Function. This is an example of a complex function: when, in order to find its value, we do the first action directly with the variable, and then another second action with what happened as a result of the first.
In other words, A complex function is a function whose argument is another function: .
For our example, .
We may well do the same actions in reverse order: first you square, and then I look for the cosine of the resulting number:. It is easy to guess that the result will almost always be different. An important feature of complex functions: when the order of actions changes, the function changes.
Second example: (same). .
The last action we do will be called "external" function, and the action performed first - respectively "internal" function(these are informal names, I use them only to explain the material in simple language).
Try to determine for yourself which function is external and which is internal:
Answers: The separation of inner and outer functions is very similar to changing variables: for example, in the function
- What action will we take first? First we calculate the sine, and only then we raise it to a cube. So it's an internal function, not an external one.
And the original function is their composition: . - Internal: ; external: .
Examination: . - Internal: ; external: .
Examination: . - Internal: ; external: .
Examination: . - Internal: ; external: .
Examination: .
we change variables and get a function.
Well, now we will extract our chocolate - look for the derivative. The procedure is always reversed: first we look for the derivative of the outer function, then we multiply the result by the derivative of the inner function. For the original example, it looks like this:
Another example:
So, let's finally formulate the official rule:
Algorithm for finding the derivative of a complex function:
It seems to be simple, right?
Let's check with examples:
Solutions:
1) Internal: ;
External: ;
2) Internal: ;
(just don’t try to reduce by now! Nothing is taken out from under the cosine, remember?)
3) Internal: ;
External: ;
It is immediately clear that there is a three-level complex function here: after all, this is already a complex function in itself, and we still extract the root from it, that is, we perform the third action (put chocolate in a wrapper and with a ribbon in a briefcase). But there is no reason to be afraid: anyway, we will “unpack” this function in the same order as usual: from the end.
That is, first we differentiate the root, then the cosine, and only then the expression in brackets. And then we multiply it all.
In such cases, it is convenient to number the actions. That is, let's imagine what we know. In what order will we perform actions to calculate the value of this expression? Let's look at an example:
The later the action is performed, the more "external" the corresponding function will be. The sequence of actions - as before:
Here the nesting is generally 4-level. Let's determine the course of action.
1. Radical expression. .
2. Root. .
3. Sinus. .
4. Square. .
5. Putting it all together:
DERIVATIVE. BRIEFLY ABOUT THE MAIN
Function derivative- the ratio of the increment of the function to the increment of the argument with an infinitesimal increment of the argument:
Basic derivatives:
Differentiation rules:
The constant is taken out of the sign of the derivative:
Derivative of sum:
Derivative product:
Derivative of the quotient:
Derivative of a complex function:
Algorithm for finding the derivative of a complex function:
- We define the "internal" function, find its derivative.
- We define the "external" function, find its derivative.
- We multiply the results of the first and second points.
Sergei Nikiforov
If the derivative of a function is of constant sign on an interval, and the function itself is continuous on its boundaries, then the boundary points are attached to both increasing and decreasing intervals, which fully corresponds to the definition of increasing and decreasing functions.
Farit Yamaev 26.10.2016 18:50
Hello. How (on what basis) can it be argued that at the point where the derivative is equal to zero, the function increases. Give reasons. Otherwise, it's just someone's whim. By what theorem? And also proof. Thank you.
Support
The value of the derivative at a point is not directly related to the increase of the function on the interval. Consider, for example, functions - they all increase on the segment
Vladlen Pisarev 02.11.2016 22:21
If a function is increasing on the interval (a;b) and is defined and continuous at the points a and b, then it is increasing on the segment . Those. the point x=2 is included in the given interval.
Although, as a rule, increase and decrease is considered not on a segment, but on an interval.
But at the very point x=2, the function has a local minimum. And how to explain to children that when they are looking for points of increase (decrease), then we do not count the points of local extremum, but they enter into the intervals of increase (decrease).
Considering that the first part of the exam for " middle group kindergarten", then perhaps such nuances are too much.
Separately, many thanks for the "I will solve the exam" to all employees - an excellent guide.
Sergei Nikiforov
A simple explanation can be obtained if we start from the definition of an increasing / decreasing function. Let me remind you that it sounds like this: a function is called increasing/decreasing on the interval if the larger argument of the function corresponds to a larger/smaller value of the function. Such a definition does not use the concept of a derivative in any way, so questions about the points where the derivative vanishes cannot arise.
Irina Ishmakova 20.11.2017 11:46
Good afternoon. Here in the comments I see beliefs that borders should be included. Let's say I agree with this. But look, please, at your solution to problem 7089. There, when specifying intervals of increase, the boundaries are not included. And that affects the response. Those. the solutions of tasks 6429 and 7089 contradict each other. Please clarify this situation.
Alexander Ivanov
Tasks 6429 and 7089 have completely different questions.
In one, there are intervals of increase, and in the other, there are intervals with a positive derivative.
There is no contradiction.
The extrema are included in the intervals of increase and decrease, but the points at which the derivative is equal to zero do not enter the intervals at which the derivative is positive.
A Z 28.01.2019 19:09
Colleagues, there is a concept of increasing at a point
(see Fichtenholtz for example)
and your understanding of the increase at the point x=2 is contrary to the classical definition.
Increasing and decreasing is a process and I would like to adhere to this principle.
In any interval that contains the point x=2, the function is not increasing. Therefore, the inclusion of the given point x=2 is a special process.
Usually, to avoid confusion, the inclusion of the ends of the intervals is said separately.
Alexander Ivanov
The function y=f(x) is called increasing on some interval if the larger value of the argument from this interval corresponds to the larger value of the function.
At the point x = 2, the function is differentiable, and on the interval (2; 6) the derivative is positive, which means that on the interval )


